A daily report is one of the key aspects to a successful restaurant business. For one simple reason – successful days turn into successful weeks, which turn into successful months and quarters. By focusing on single days, labor management and driving sales – small mom and pop restaurants as well as corporate restaurant chains can find success.
I’m assuming you are here because you want to manage key aspects of your business better. A daily report specific to your restaurant will do just that. By focusing on sales, payroll expense, food cost and other key expense metrics – you can easily ensure you are running a profitable restaurant daily (excluding one-off expenses).
I am a firm believer of developing a daily report customized for your specific business. Focusing on the key drivers of your establishment are always better than focusing on industry specific drivers. Either way, this post will cover some key aspects of the daily report and help you develop the best path to success for your business.
Key Report Drivers:
Daily Sales – Simply take your daily sales report from your point of sale system (POS) and enter into the report provided at the end of this post. This should be divided into both food and beverage as each will have a different cost of goods (food is usually higher than beverage). Remember sales tax is a pass through and should not be included in the above number.
Daily Labor – This could be taken from your point of sale system or payroll tracking software. Most of the time this will not include your payroll tax rate expense – so we will need to take this from the previous period and use a blended average. This should be divided between back of house and front of house so we can ensure your kitchen’s productivity matches their sales output and vice versa for beverage.
Cost of Goods – The metric that decides the fate of a restaurant. This average should be taken from your most recent month or quarter. For those launching a new venture – take your blended estimated cost from your beverage manager and your chef. If that doesn’t work, use 35% for Food and 25% for Beverage – resulting in an average blended around 30% (increase if you know you are running higher).
Rent – Hopefully your biggest expense after your cost of goods is your rent – this daily overhead is likely somewhere between 5% to 10% of your monthly expenses. Those outside large metro areas and suburbs should have a percentage that’s less than the aforementioned range. Take your monthly rental statement (including real estate tax, cam fees, utilities) and divide that by the number of days in the month. This will help you calculate what you need to cover this on a daily basis.
Credit Card Fees – This 2.5% adds up quickly and is extremely easy to track. If your sales are mostly paid with credit cards use 2.5% for the entire total of sales. If it is split 50% – 50% between credit cards and cash, take 1.25% over the total sales (if your blended credit card average is higher than 3% – you have other issues and need to call me ASAP).
P.S. For operators in big cities, take a look at your delivery fees and ensure you use that in your daily calculation alongside Credit Card Fees.
Cleaning Service – For large operations, they usually outsource cleaning to an outside service. Sometimes this can add up to a large percentage of sales (3% to 5%). Similar to rent, take the monthly amount and divide by the number of days in a month. Feel free to substitute cleaning service with other large fixed cost you have on a monthly basis.
Other Fixed Monthly Expenses – Every operation is different and has its unique nuances. It is likely you have some other large expenses that were not covered in this list. If they are monthly – calculate the daily expense. If they are a percentage of sales or labor, take the daily average. Either way – make sure you include it to ensure you are operating a profitable entity.
Let’s Take a Look an Actual Report

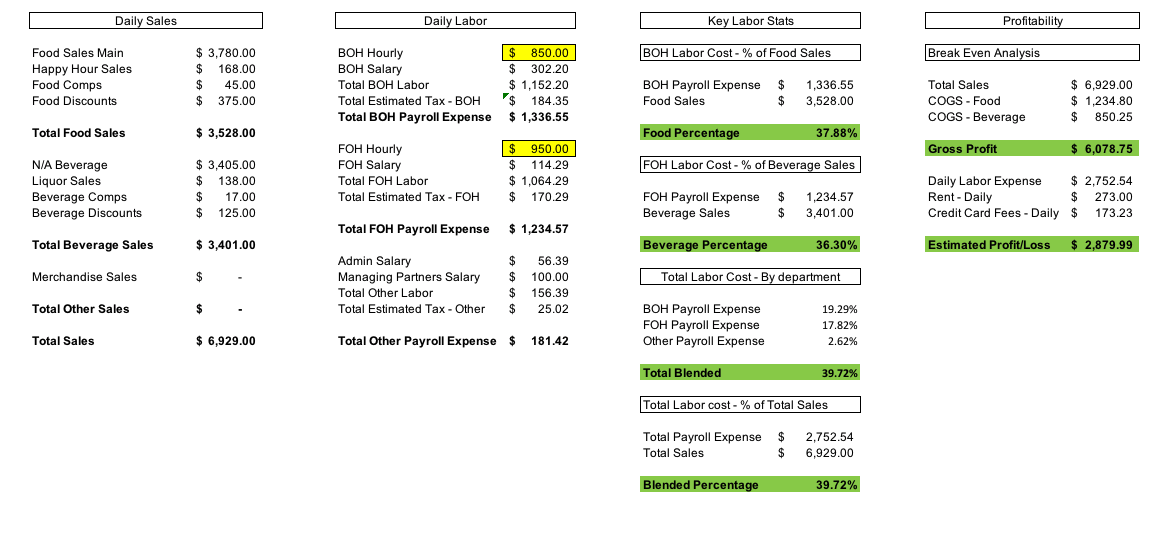
For this client, the daily labor expense was an input – why it was highlighted in yellow. This report can be build to pull all the necessary data from your system exports.
Let’s Break down the Report
Daily Sales

We review all sales – breaking it down as we do on our income statement either by meal period, beverage type, etc. It is important that this it totaled by both food and beverage to calculate our correct margin.
Daily Labor

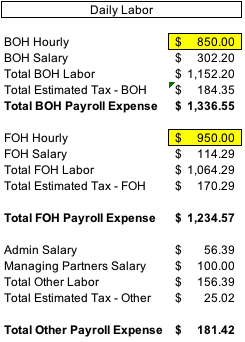
The key to this report is to include our fixed salaries, be it an executive chef, floor manager or managing partner, or administrative staff. These are fixed and can be calculated down to a daily expense. Oftentimes, when analyzing daily profitability, fixed salaries are excluded or forgotten – they are never forgotten when calculating your monthly profit and loss. The other key takeaway for the above is the need to ensure you estimate your employer tax expense. This can easily add up to a few hundred dollars a day for a decent sized establishment.
Key Labor Stats

It’s important to know where your expenses are coming from. What sales are these expenses driving or what department are associated with? Key to managing labor is to ensure that the kitchen expense is actually driven by food sales. Are you just spending dollars on BOH to lose money? Ensure they are productively driving sales by watching that key margin.
Profitability

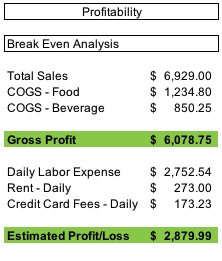
Why enter into business? To make a profit, to feed our family? To make a living on our own terms. Fortunately, business success is binary, black or white, profit or loss. You should be tracking your profitability daily, ensuring you are making money every day of operation – ensuring that you are realizing your dreams. If you are not profiting or breaking even daily, you need to adjust and better manage your business. That is why this aspect of the report is key to driving long term business success.
Taking It a Step Further
There are plenty of additional items to track. My goal was to give you a brief overview of the key metrics and ensure you weren’t overwhelmed. Below are some additional items that you could include if you needed to get a better grasp of your business.
Customer Count
Knowing how many customers walk in the door everyday will help you better understand you business. How many visitors did we have today? How many dollars in sales did that turn into? Was it more or less than our average day? Why was that the case? Was this affected by the weather or season? Understanding the cause and effect of a profitable day will ensure the long run success of your business. Know your numbers and know your revenue drivers.
Average Ticket
Are your customers spending more or less today? What is causing this? Is your team upselling better? Did your customers love your daily specials? There are so many aspects to increasing that ticket price and getting the most out of your customer. Track this data to ensure you do more in driving that average ticket price – because that is by far the easiest way to drive more revenue.
Year over Year Performance (adjusted for day of the week)
Is your business growing? Are you performing better than last year? Understanding where your business is trending before you get your monthly or quarterly financials is the key to long term success. It is the concept of being proactive versus reactive. Tracking this year’s performance over last year’s performance will help you better understand what is going on and how to anticipate the move you need to make.
Download My Daily Report Excel Sample
Want to take the report from above and manipulate it for your own business? Sure – download it here!
Need More Help?
Need help setting up this report for you business? I am glad to create a customized daily report here – learn more by clicking here.

Leave a Reply